Plot Nice 3D Scatter Graphs
Posted on Auguest 18, 2014 by Dr. Saeid Nourian
 Plotting
scatter graphs in 3D faces certain challenges that are not present in
2D. The most significant challenge is to distinguish the scatter points
from each other without distraction from neighboring points or the points
that are in front or behind the point of interest. Fortunately Graphing
Calculator 3D has just the right features to generate clear
visualization of your scatters plots.
Plotting
scatter graphs in 3D faces certain challenges that are not present in
2D. The most significant challenge is to distinguish the scatter points
from each other without distraction from neighboring points or the points
that are in front or behind the point of interest. Fortunately Graphing
Calculator 3D has just the right features to generate clear
visualization of your scatters plots.
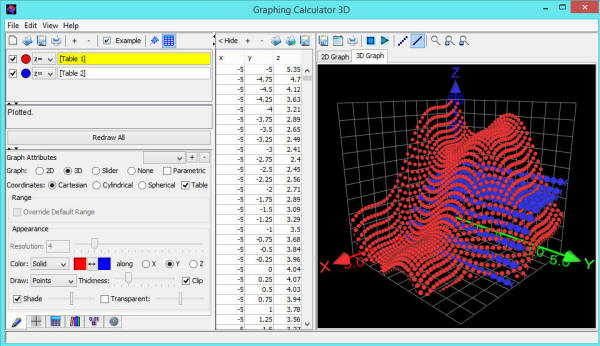
Plotting Scatter Graphs in 3D
To plot scatter graphs you can simply type the 3d coordinates of your points. Alternatively you can import the data from csv files or even feed live data files into the software.
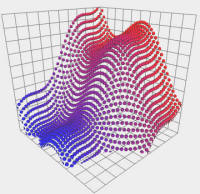
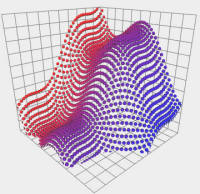
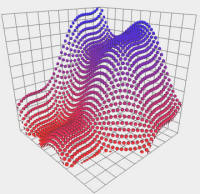
Better Visualization With Shading
When you plot a table of x,y,z coordinates they are rendered as 3D spheres with all the 3D shading effects that comes with it. The shading helps distinguish points that that overlap with each other. The 3D effect helps in determining which points are closer or farther from camera.

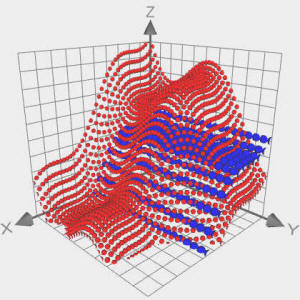
Colored Scatter Points
Each set of points can have a different color to be distinguished from other sets. In additional you can customize the color of each set to have a gradual shading effect that shifts the color from say blue to red in order to highlight a change in x, y, or z values.
Intuitive User Interface
Most tasks are fully automated and any change in data or visual settings cause an automatic redraw of the scatter plots. The user interface is specially designed in such a way that the most frequently used features are only a click away.
Most of the features explained above are available in the free version. However the ability to import points from csv files is only available in the paid editions. Download the free edition of Graphing Calculator 3D if you haven't done so already and try plotting some of your own scatter graphs.
