Plot Implicit Functions in 3D
Posted on Sept 25, 2014 by Dr. Saeid Nourian
 Plotting
implicit equations is made incredibly easy in the new version of Graphing
Calculator 3D. You can plot equations of any complexity without the
restriction of starting them with z= or y=.
Plotting
implicit equations is made incredibly easy in the new version of Graphing
Calculator 3D. You can plot equations of any complexity without the
restriction of starting them with z= or y=.
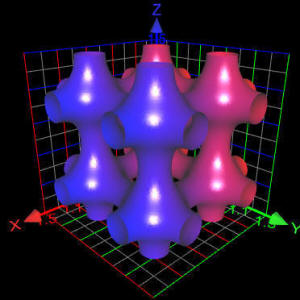
This blog describes how easy it is to plot implicit equations and isosurface graphs with Graphing Calculator 3D.
Plotting functions that start with 0=
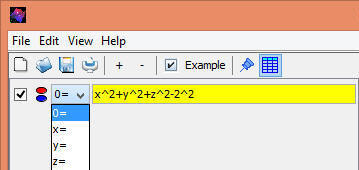
The quickest way to plot an implicit function is to select 0= from the drop-down list next to the equation (see image below). After this you may complete the equation by typing it down.
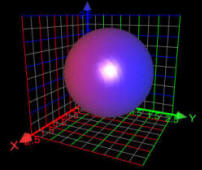
For example to plot this:
x^2+y^2+z^2-2^2=0
you can type the left side of the equation as shown here:
 Plotting
arbitrary implicit equations
Plotting
arbitrary implicit equations
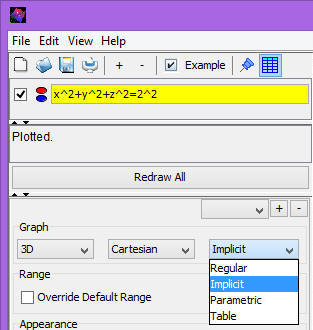
For maximum flexibility select "Implicit" from the Graph drop-down as shown on the right. This action will convert the equation textfield to a form that allow typing arbitrary implicit equations.
Note that you need to have equal (=) sign somewhere in your equations. For example when plotting x^2+y^2+z^2=2^2 you should type it in exactly as is.
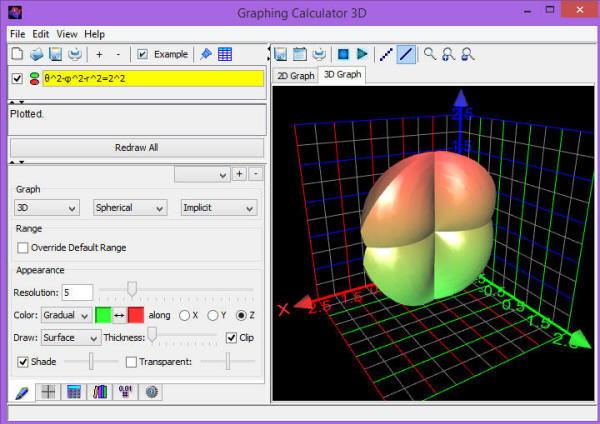
Plotting polar, cylindrical and spherical implicit equations
Plotting implicit equations in polar coordinates follows exactly the same steps as described above. Except instead of x, y and z your equation would contain θ φ z and r. An example is shown below.
Note: In order to type θ, φ and r use Ctrl+1 Ctrl+2 and Ctrl+3 respectively when in spherical coordinates mode. These short-keys will insert whichever variable applies to current coordinates.
Download Implicit Grapher
You can download implicit grapher and try the above examples in it.
