Import & Plot Live Data in 3D
Posted on July 27, 2014 by Dr. Saeid Nourian
 Most
graphers allow some sort of importing coordinates to be plotted but very
few allow importing live data. The few graphers that do support live
data either require complicated scripts or are limited to 2D plots. But
now plotting live data points is made easy thanks to the new
capabilities of Graphing Calculator 3D software.
Most
graphers allow some sort of importing coordinates to be plotted but very
few allow importing live data. The few graphers that do support live
data either require complicated scripts or are limited to 2D plots. But
now plotting live data points is made easy thanks to the new
capabilities of Graphing Calculator 3D software.
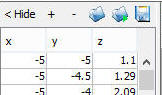
Import Live CSV Data
There are two import buttons located on the toolbar above the table of
values: One is for regular static imports, the other is for live data
import. Click on the
![]() button with tooltip that reads "Import live coordinates". Then select
your live csv file.
button with tooltip that reads "Import live coordinates". Then select
your live csv file.
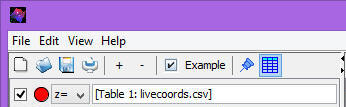 After
successfully importing and linking to your live csv file you should see
the name of your equation change to
After
successfully importing and linking to your live csv file you should see
the name of your equation change to
[Table #: filename.csv]
as shown on the right.
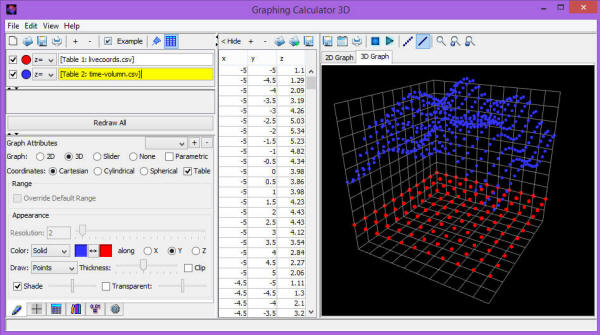
Plot Live Data
After importing you do not need to do anything addition to plot live data. Graphing Calculator 3D continuously monitors the modification timestamp of the live csv file. As soon as a change is detected the software automatically reads the new data from the csv file and plots/updates the graph.
You can link the software to as many live data as you like and plot them simultaneously with different colors. You can save a Graphing Calculator 3D project file that has one or more live data and re-open it at a later time. Upon opening, the software will automatically resume monitoring all live data resources.
Download 3D Graphing Calculator
This feature is available on the professional edition only. You can purchase the professional edition of 3D Graphing Calculator if you haven't done so already and try importing your own live csv files.
