Graphing Calculator 3D CSV Points
This page explains how to import points from a csv file and plot them in Graphing Calculator 3D.
Steps:
- Select "3D" graph option if not already selected.
- [Optional] Change the graph type from "Equation" to "Table" in the dropdown list.
- Click on File > Import Coordinates... menu, then select your csv file. Alternative you can click on Import Coordinates button on the toolbar.
- [Optional] Drag the Thickness slider to increase or decrease the thickness of scatter points.
CSV format:
This app is flexible in the format of csv. If any invalid value is found it is simply ignored and only the valid coordinates are imported.
- CSV file can use comma, semicolon or tab to separate values.
- CSV file can have a header column. The header column will be automatically ignored.
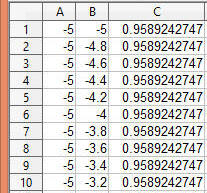
- CSV file can have any number of columns, but only the first 2 to 5 columns will be considered depending on the graph type.
- If you select 3D Cartesian coordinates then the first 3 columns will be read and assigned to x, y, z.
- If an invalid number is found then the corresponding row will be skipped. Upon competition of import a warning will be displayed with number of skipped rows.
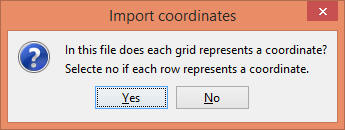
- The app can also read CSV files in grid arrangement where the first row indicates the x values and the first column indicates the y values and all other cells indicate the z values. If such arrangement is detected the app will ask for confirmation via dialog box below.