Graphing Calculator 3D Contours
This page explains how to plot a 3D contour in Graphing Calculator 3D.
Steps:
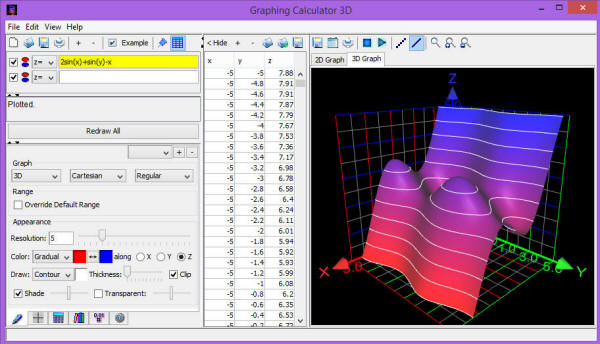
- Plot your equation in 3D.
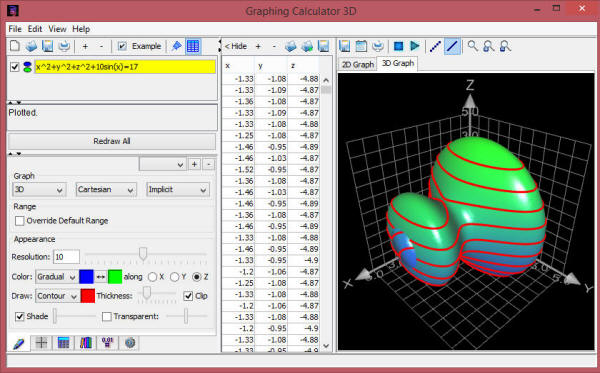
- From "Draw" combo-box select "Contour".
- [Optional] Click on the color box to select a color for your contour.
- [Optional] Click on the button with 3-lines icon. This will pop up a dialog box that allows you to specify the exact z-levels of contour lines.
- [Optional] Drag the Thickness slider to increase or decrease the thickness of contour lines.