Graphing Calculator 3D Cylindrical Equations
This page explains how to plot a 3D equation in Graphing Calculator 3D.
Steps:
- Select "3D" graph option if not already selected.
- Change the coordinates option from "Cartesian" to "Cylindrical" in the dropdown list.
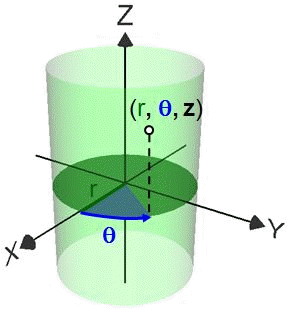
- Type in a cylindrical equation using variables θ, z and r.
- To insert θ press Ctrl+1
- Alternatively, to insert θ use the keypad by clicking on KeyPad tab button.
- You may use θ and z variables if "r=" is selected.
- You may use θ and r variables if "z=" is selected.
- You may use z and r variables if "θ=" is selected.
Examples:
Here are some explicit and implicit cylindrical equations you can type in the program:
- r=θ+z
- θ=r/2
- r^2+θ^2+z^2=sin(r+θ)
- r<1+θ
Optional Steps:
- Click on "Graph" tab then click on "Override Default Range" to limit the range of θ, z and r values.